Originally published March 3, 2013. Updated September 28, 2026.
The US wasted 65.8% of the primary energy it consumed in 2024, or 62.27 of 94.6 quadrillion Btu, according to Lawrence Livermore National Laboratory’s annual energy flow chart. Most of that loss happens before a fuel or a kilowatt reaches your meter, as heat that never turns a wheel or lights a room. That share hasn’t moved much in years, even after a decade of cheaper LED bulbs and tighter appliance rules.
How much energy the US wastes
Total US energy use splits into two buckets on that LLNL chart. One bucket is energy that does something, like running a motor or heating a room. The other is energy that’s rejected along the way, mostly as waste heat from burning fuel and generating power. In 2024, only 32.34 quadrillion Btu counted as useful energy services, the other 34.2% of the total.
A year earlier, in 2023, the chart put total consumption at 93.6 quadrillion Btu with 65.7% rejected, almost identical to 2024’s share. Whatever you paid for gas, electricity or heating oil that year, roughly two out of every three Btu never reached a light, a motor or a furnace vent as useful heat.
Behind that flat total, the generation mix shifted. Natural gas supplied a record 34.3 quadrillion Btu in 2024, and renewables supplied a record 8.7 quadrillion Btu. Coal fell to a record low of 7.9 quadrillion Btu. None of that moved the rejected share.
Where the wasted energy goes, sector by sector
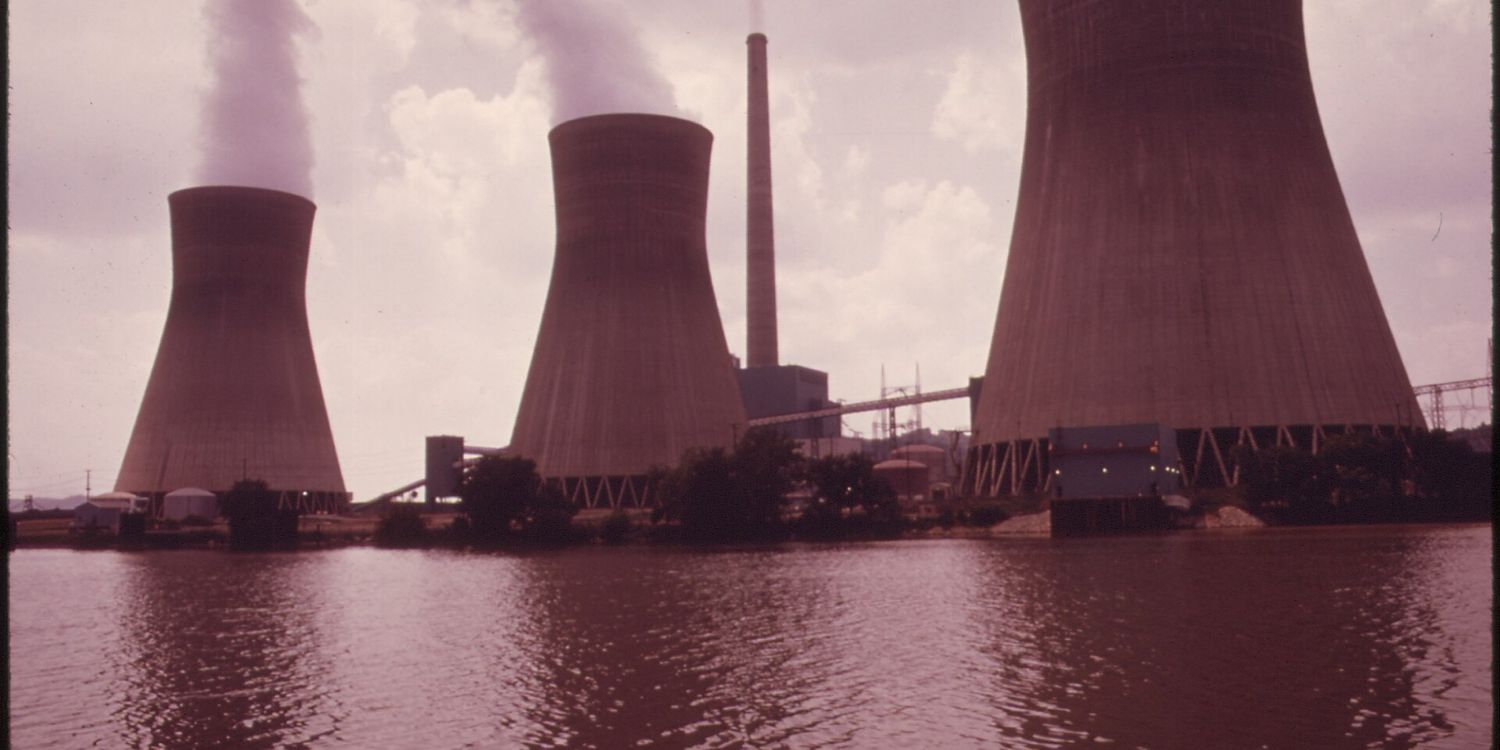
Power plants and vehicles reject more energy than anywhere else in the system. Converting fuel to electricity lost 19.21 of 32.77 quadrillion Btu in 2024, a 58.6% loss rate. That works out to roughly 41% conversion efficiency for the average US power plant, a different number than a plant’s capacity factor, which tracks how much of its yearly potential it delivers. See the capacity factor breakdown for that number by source.
Picture the heat and exhaust pouring out of a tailpipe, gasoline you paid for at the pump that never turned a wheel. Transportation runs almost entirely on combustion, which is why LLNL attributes its loss to an assumed 21% end-use efficiency for engines and drivetrains. That leaves 22.35 of 28.29 quadrillion Btu rejected in 2024, a 79% loss rate, the highest of any sector.
Industry and buildings reject a smaller share of what they use. The table below breaks out each sector’s 2024 loss rate, from industry down through homes and businesses. At home, less of what you pay for in electricity and gas leaks away as heat than what leaves as exhaust from your car.
| Sector | Energy in (quads) | Rejected (quads) | Share rejected |
|---|---|---|---|
| Electricity generation | 32.77 | 19.21 | 58.6% |
| Transportation | 28.29 | 22.35 | 79% |
| Industry | 26.39 | 13.46 | 51% |
| Residential | 11.23 | 3.93 | 35% |
| Commercial | 9.49 | 3.32 | 35% |
Source: Lawrence Livermore National Laboratory, 2024 US Energy Flow Chart
Is US energy efficiency improving
By some measures, yes. US energy intensity, the amount of energy it takes to produce a dollar of GDP, fell from 5.03 to 4.05 thousand Btu per dollar between 2015 and 2024, a drop of about 19.5%, according to EIA. Energy use per person fell too, from 295 to 278 thousand Btu over the same years. If your home has swapped in an LED bulb or a more efficient furnace, that’s part of the same trend, even though the national rejected-energy share hasn’t followed it down.
Why bigger efficiency gains haven’t moved the total
LED bulbs and better appliances deliver real, measured savings, but they’re small next to the two categories that dominate rejected energy, transportation and power generation. LEDs saved an estimated 1.1 quadrillion Btu in 2017, about $12 billion in avoided energy costs that year, according to the Department of Energy’s solid-state lighting forecast. Transportation alone rejected 22.35 quadrillion Btu in 2024. Those numbers come from different years and aren’t a direct comparison, but lighting is a small slice of a total that transportation fuel and power-plant conversion losses dominate.
Even DOE’s most optimistic case falls short of that total. That scenario projects cumulative LED savings of 78 quadrillion Btu and about $890 billion in avoided costs from 2017 to 2035. Rejected energy alone topped 62.27 quadrillion Btu in 2024, more than DOE’s entire 18-year projection combined. Whatever you’ve swapped to LEDs at home, the national total barely moves, because lighting is a sliver of a system where cars and power plants do the rejecting.
A 2013 estimate from Energy Collective, citing a 2008 study, put US efficiency at 42%. LLNL’s 2024 chart puts useful energy at 34.2% of total consumption, lower than that decade-old figure.
LED lighting is the easy win worth taking
At the bulb level, the payoff is real. ENERGY STAR-certified LEDs use 90% less energy than incandescent bulbs, a gap wide enough that EPA retired the dedicated ENERGY STAR light bulb label because it’s no longer possible to buy an inefficient bulb for most household uses. More than 3 billion ENERGY STAR certified bulbs have sold in the US since the label launched in 1997.
If you still have an old incandescent bulb somewhere in the house, swapping it for one of those LEDs is the way to use less power for the same light.
The federal floor is rising too. A new Department of Energy standard raises minimum bulb efficacy from 45 to more than 120 lumens per watt, a separate action from the incandescent phase-out already in force, and takes effect in 2028. DOE projects it will save $1.6 billion a year and $27 billion cumulatively over 30 years.
Over that same span, the agency expects it to cut 70 million metric tons of CO2. That’s a floor every bulb sold after 2028 has to clear, so the swap in your house eventually happens automatically, whether you shop for it or not.
Adoption still has room to run. As of 2020, LEDs made up about 48% of installed lighting units in the US, meaning the other 52% of fixtures were still due for the swap, the most recent figure DOE has published. If your own home hasn’t swapped every fixture yet, the data says you have company.
Buildings already run more efficiently than transportation or industry
Residential and commercial buildings together used 27.6% of US end-use energy in 2023, or 36.9% of total US energy once you count the electricity-generation losses baked into every kilowatt-hour the grid delivers to them, according to EIA. Even so, homes and businesses reject a smaller share of what they use than transportation or industry does. Residential and commercial use both rejected 35% of their energy in 2024, well below transportation’s 79% and industry’s 51%.
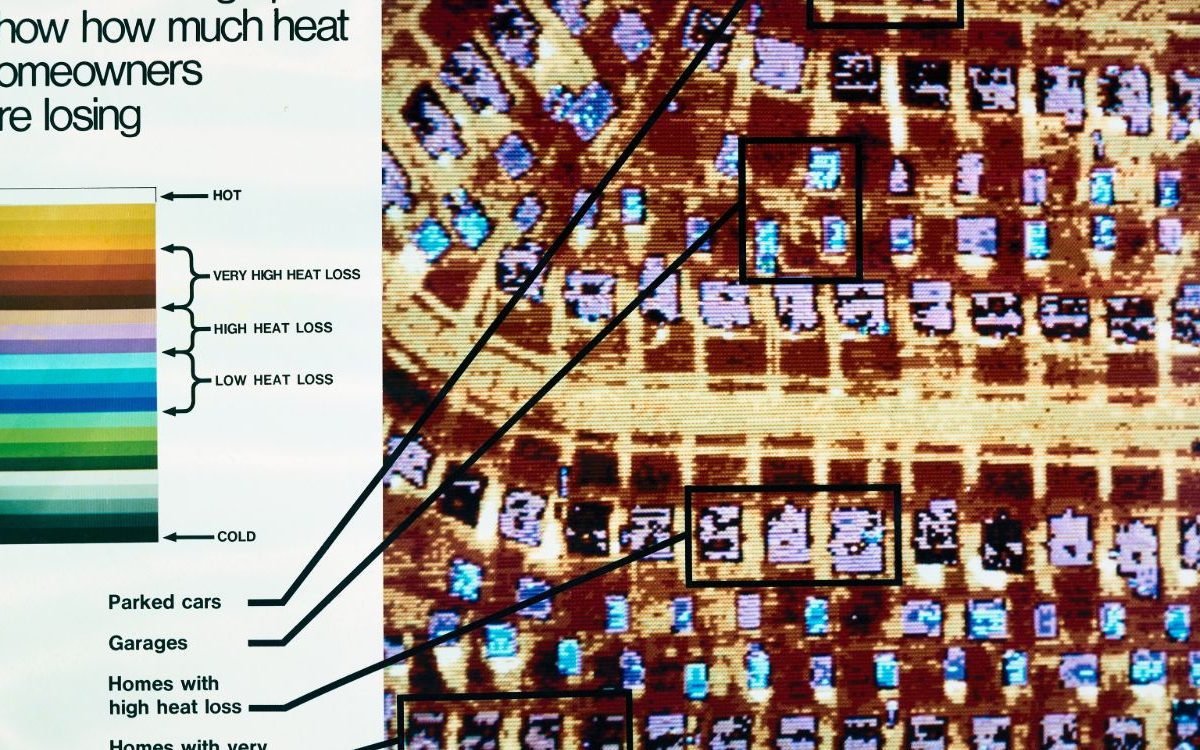
That 35% figure is one of LLNL’s fixed modeling assumptions for how efficiently buildings use the energy delivered to them. The lab doesn’t remeasure it every year, so it can’t say on its own how fast the US building stock is improving. A lot of what a building wastes leaves as heat. If you want to know where that heat escapes a house, there’s a separate breakdown.
What the lightbulb standard means for your own bulbs
Transportation and power plants remain the two places most of the waste happens, since transportation rejects more energy than any other sector and runs almost entirely on combustion. Moving cars from combustion to electric drivetrains does not eliminate that loss. It relocates the loss from the tailpipe to the power plant, where average conversion efficiency is only about 41%.
The lightbulb standard is the one policy here with clear, sourced numbers on both sides of the change. It takes effect in 2028 and applies to every bulb sold after that date, so the upgrade happens the next time an old bulb burns out, with no separate purchase decision required. DOE projects that single change will save $1.6 billion a year once every bulb sold meets the new floor. You’ll see your share of that saving in your own electric bill, starting with the next bulb you replace.