Originally published August 9, 2013. Updated September 28, 2026.
Power density measures how many watts a source produces per square meter of land, and a median natural gas plant manages about 482 while a median wind farm stays under 2 W/m². That gap is why a wind or solar project proposed for your county can tie up thousands of acres to match what a gas plant does on a couple of city blocks. Nuclear runs about 241 W/m², and utility solar comes in around 6.6 once you count the land under the panels.
What power density measures
Robert Wilson, a mathematical ecology researcher, raised the term on this site in a 2013 piece called “Why Power Density Matters.” He wasn’t ranking cost or plant capacity factor, the share of a plant’s rated output it delivers over a year. He was measuring something narrower, how many watts each square meter of land gives off for the plant or farm sitting on it.
That’s also a different measure from energy density, which packs energy into a fuel’s weight in megajoules per kilogram, and matters more for questions like why jet fuel is hard to replace with batteries. Power density is about the footprint a source needs on the ground, the acreage your town’s planning board has to sign off on.
Wilson’s 2013 estimates put wind at 2 to 3 W/m². Solar ran 5 to 20, depending on climate. Biofuels came in at 0.5 to 2, and fossil fuel or nuclear plants ran above 100. Those figures were rough and self-sourced, and a peer-reviewed dataset came a few years later.
How many watts each energy source packs into a square meter
A 2018 meta-analysis by van Zalk and Behrens, published in Energy Policy, pulled power-density figures from real US project data across nine energy sources. Their medians:
| Energy source | Median power density (W/m²) |
|---|---|
| Natural gas | 482.1 |
| Nuclear | 240.8 |
| Oil | 194.6 |
| Coal | 135.1 |
| Solar (utility PV) | 6.63 |
| Geothermal | 2.24 |
| Wind | 1.84 |
| Hydropower | 0.14 |
| Biomass | 0.08 |
Source: van Zalk and Behrens, Energy Policy (2018).
Biomass sits at the bottom of that table even though it’s often marketed as a low-carbon fuel. Is biomass carbon neutral? covers why that pitch is more complicated than it sounds.
If your utility explains away a new gas plant getting approved faster than a solar farm of the same output, this table is usually the quiet reason. Gas needs 482 W/m² where solar needs 6.6, so the solar project needs far more land to clear the same permitting bar.
Vaclav Smil, who wrote the book on this exact subject in Power Density (2015, MIT Press), reports broadly similar ranges from his own research. His published figures, as reported by MasterResource, put solar PV at 4 to 9 W/m². Wind ran 0.5 to 1.5, depending on the site. Natural gas, in his numbers, runs far higher, from 200 to 2,000.
What it takes to power a city-sized load, source by source
Delivering 1,000 megawatts around the clock, roughly what a large power plant produces, takes about 2.1 square kilometers at natural gas’s median density, about four-fifths of a square mile. At nuclear’s median density, the same job takes about 4.2 square kilometers, 1.6 square miles. Coal needs about 7.4 square kilometers, 2.9 square miles.
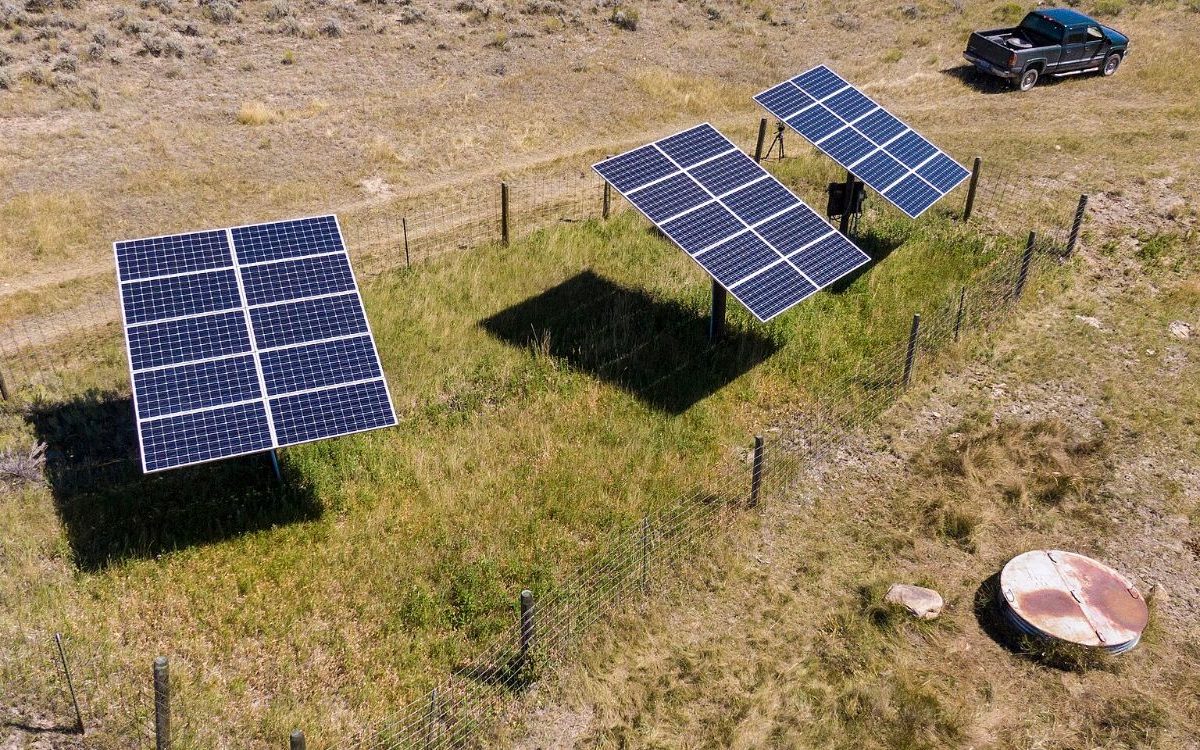
Solar and wind change the math by an order of magnitude. Solar’s median density needs about 151 square kilometers of panels for that same load, 58 square miles, close to 37,000 acres. Wind’s footprint, spacing included, runs to about 544 square kilometers, 210 square miles, more than triple solar’s footprint and roughly 260 times gas’s.
If that wind farm went up in your county, its footprint could be bigger than the county itself across much of the country. Even before capacity factor enters the picture, since real wind and solar farms don’t run non-stop without storage or backup, wind needs more raw land than any of the other four sources for the same output. That’s the number a planning board sees when a developer files for two hundred square miles of leased land, and it’s also the number that gets misread, because leased and paved aren’t the same thing.
Most of a wind farm’s footprint stays in crops or pasture
That leased-versus-paved distinction is what a 2024 USDA Economic Research Service study measured directly. Looking at wind and solar projects built between 2012 and 2020, USDA found that more than 99% of the agricultural land inside wind project boundaries stayed in farming or ranching after construction. Only about 85% of agricultural land near solar farms did the same.
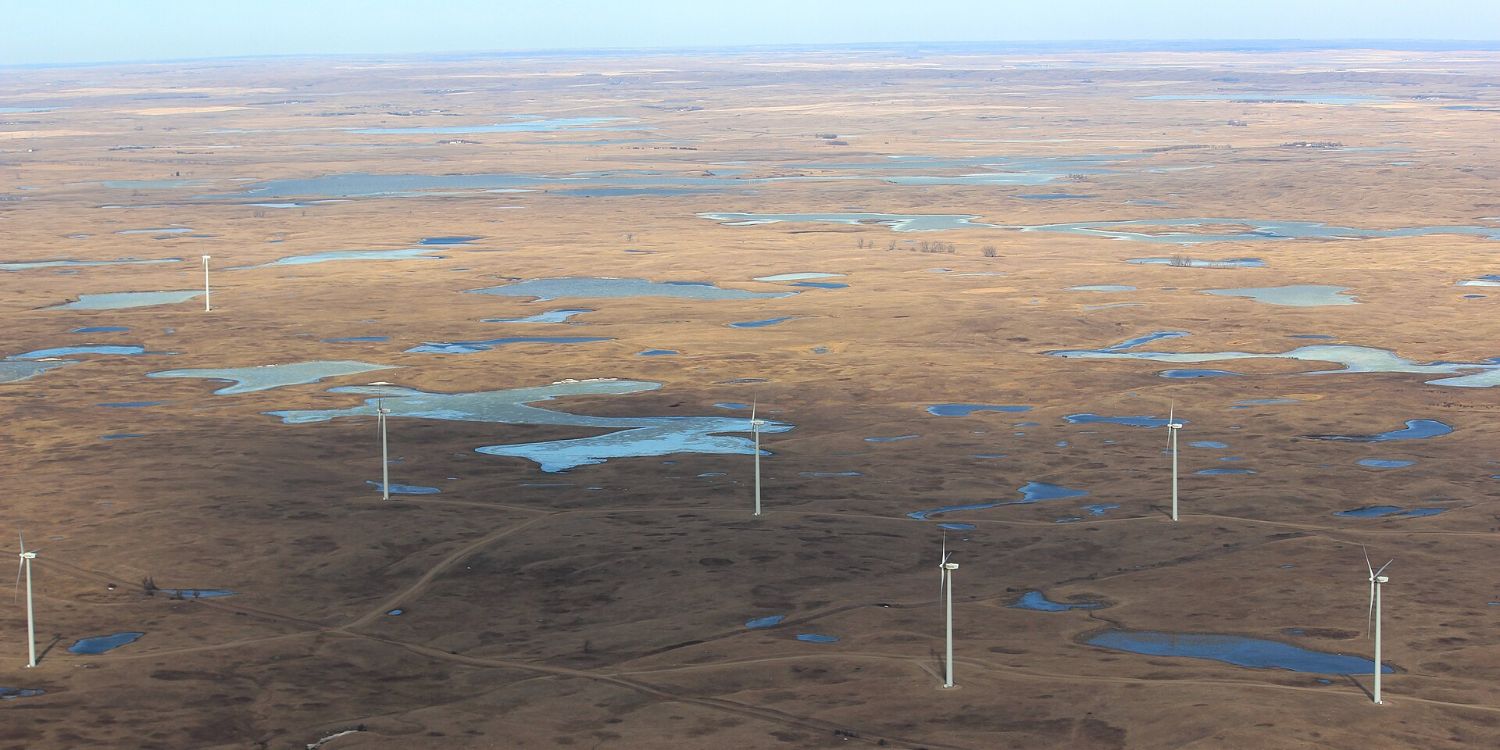
Picture what that looks like on the ground. Steel towers spaced hundreds of feet apart across a cornfield, with corn or grazing cattle filling the ground between them. If a wind developer leases part of your land, USDA’s data says the odds are above 99% that you keep farming or ranching the rest of it. Turbines and cattle sharing a field is the norm, not the exception.
NREL’s land-use numbers point to why wind and solar differ. A summary of NREL’s utility-scale solar data, published by YSG Solar, puts the land panels directly occupy at a capacity-weighted average of 7.3 acres per megawatt, rising to 8.9 acres per megawatt once support structures and setbacks are counted. The gap between those two figures is small. Solar’s leased land and its occupied land are close to the same thing, which is why a solar lease on your property usually takes the whole parcel out of other use.
Wind doesn’t work that way. Hannah Ritchie’s analysis for Our World in Data, looking at 23 major US wind farms, found land-use estimates ranging from 8 to 184 square meter-years per megawatt-hour, depending on whether the count includes the whole leased area between turbines or only the turbine pads and access roads. The ground in that gap keeps its old job. That’s what the USDA figure above is measuring.
Why low density hits renewables harder than fossil fuels
Wilson’s 2013 argument centered on dense cities, where people are packed tightly together. If you live somewhere as dense as Manhattan, the math gets hard fast. Electricity use there worked out to more than 100 W/m², something like two orders of magnitude above what a wind farm produces per square meter of its own footprint. Wilson’s conclusion was that a city that dense can’t generate enough power inside its own borders from wind or solar alone, so it has to import power from somewhere with more room, or from a source with far higher density.
The World Economic Forum, citing a 2021 UN Economic Commission for Europe life-cycle study, found that nuclear needs 27 times less land than coal and 34 times less than solar PV for the same output. That’s the density gap Wilson described, viewed from the small-footprint side instead of the sprawling one.
None of this makes wind and solar a bad bet. It does mean the land has to come from somewhere with room to spare, often a long way from the city, town or neighborhood spending the power.
What sharper data changes for the county deciding on a lease
Peer-reviewed research has sharpened Wilson’s original picture more than it’s overturned it. Van Zalk and Behrens’ 2018 medians put wind and solar even lower, at 1.84 and 6.63 W/m², than the low end of Wilson’s own estimates once real project spacing and siting losses get counted in. Fossil fuels and nuclear are now pinned to precise medians, 135 to 482 W/m², instead of Wilson’s rougher “above 100.”
USDA’s finding is the one that’s new. It measured what happens to the farmland around a wind project once it’s built and found over 99% of it stays in agriculture, the number a landowner deciding whether to sign a lease cares about. That dataset only covers projects built between 2012 and 2020, so an update will need projects built after 2020 to reach the same age.
If you’re weighing a wind or solar lease on your own land, or sitting on a zoning board that has to approve one, the land math favors gas and nuclear, and the coexistence math favors wind over solar. Both numbers are real, and neither one cancels out the other.