Geothermal energy works by piping hot water or steam from underground to a turbine, and the fluid’s state and temperature decide which of three plant designs a site needs, with 182°C (360°F) as the line for flash steam.
Geothermal meets less than 1% of world energy demand and made about 0.35% of US electricity in 2025. Enhanced geothermal systems, or EGS, crack open hot rock that lacks natural water pathways, and Fervo Energy’s first Cape Station block in Utah began commercial operation on September 30, 2026.
Top geothermal energy statistics
- US geothermal plants generated 15,628 GWh of electricity in 2025, 1.4% more than in 2024.
- Installed geothermal capacity worldwide reached 17,173 MW at the end of 2025, up 223 MW in the year.
- EIA counted 2,683.9 MW of net summer geothermal capacity in the US in July 2026.
- IRENA puts geothermal at $89 per megawatt-hour in 2025, against $44 for solar PV.
- Compared with fossil-fuel plants, geothermal plants emit about 99% less carbon dioxide.
- The IEA sees potential for up to 800 GW of geothermal capacity worldwide, about 15% of global electricity demand growth to 2050.
- Cape Station’s Phase I is about 100 MW in three 33 MW GeoBlocks, and the first reached First Power on September 24, 2026.
What is geothermal energy, and is it renewable?
EIA describes geothermal energy as heat found inside the earth and counts it as renewable because the earth constantly produces that heat. The heat comes from the slow breakdown of radioactive particles in the earth’s core.
Most major resources sit near the edges of tectonic plates, where most volcanoes are.
Geothermal also heats buildings directly. Iceland’s government says about 85% of houses there are heated with it. The earth 10 feet below your own yard stays between 50°F and 60°F, the steady temperature a geothermal heat pump draws on.
For how geothermal fits beside wind and solar, see how the renewable energy sources compare.
Three ways to turn underground heat into power
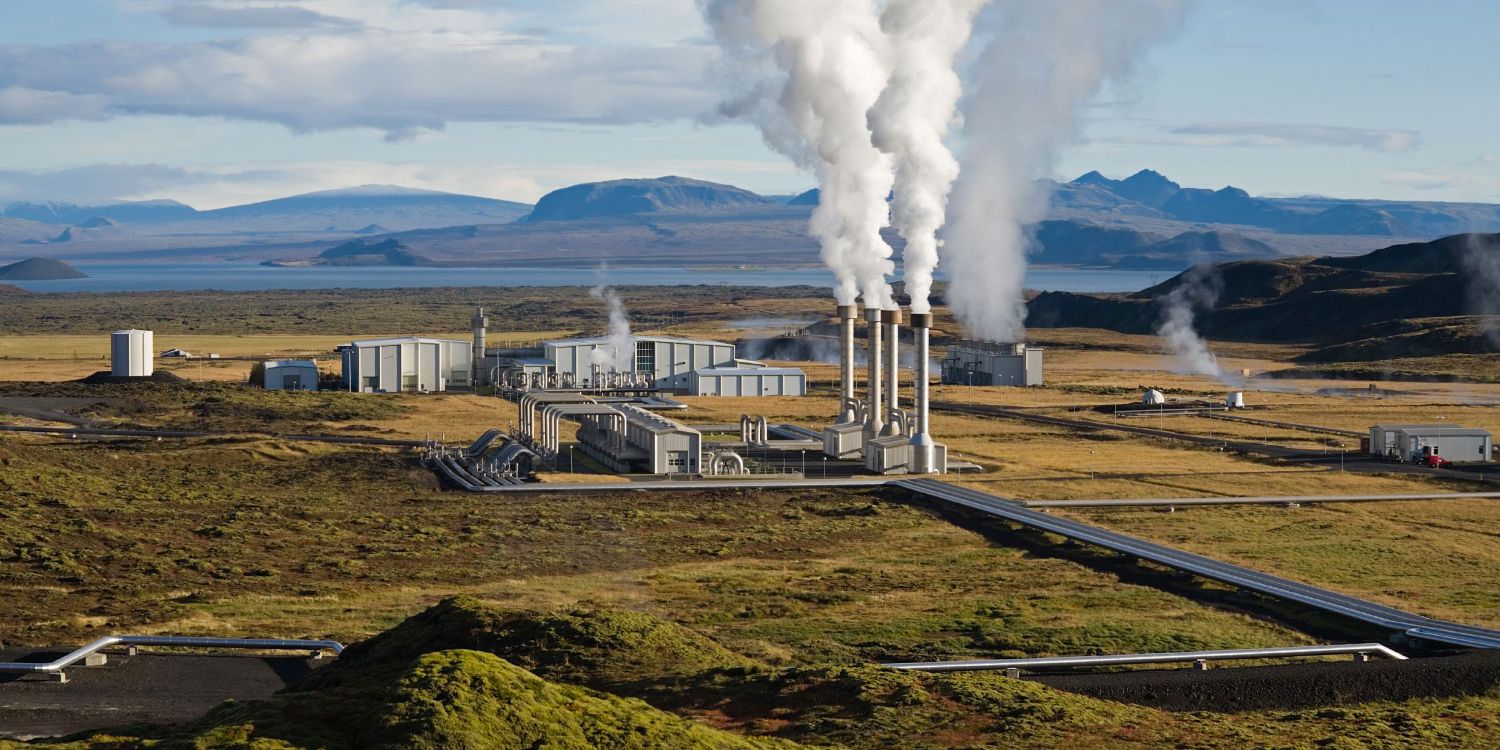
Plants fall into three designs, and the state and temperature of the underground fluid decide which one a site uses.
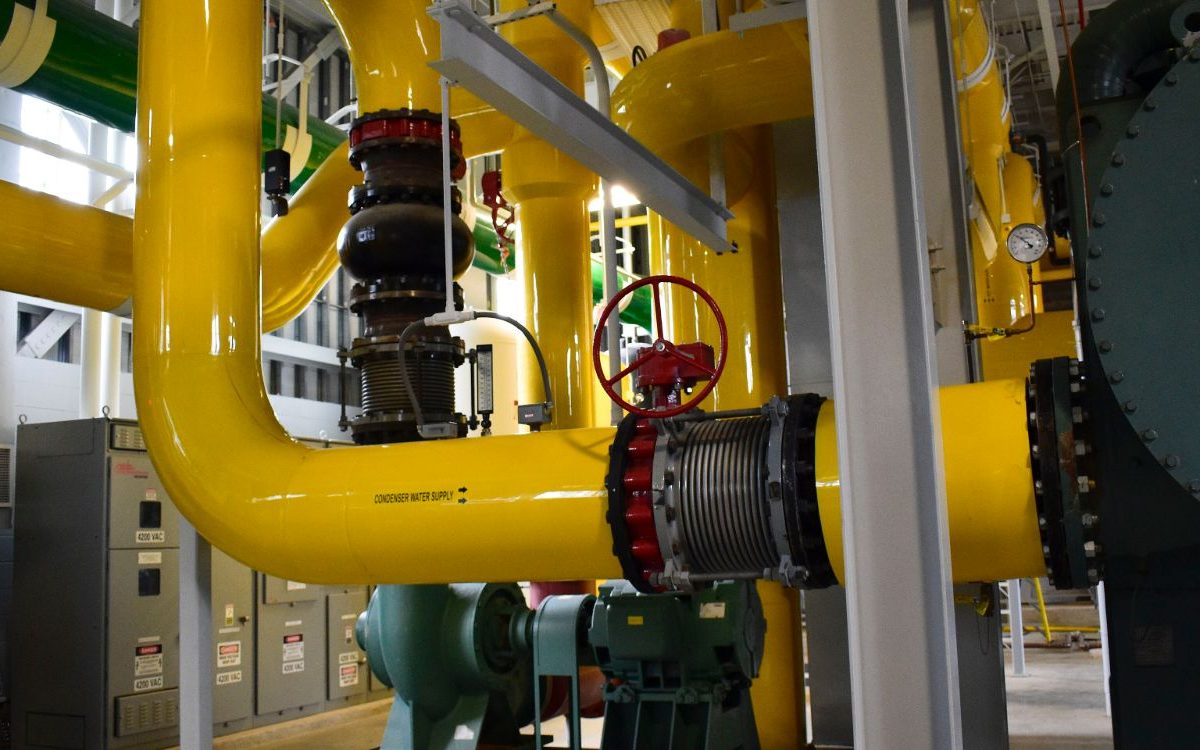
Dry steam plants are the simplest. The reservoir already produces steam, so the steam runs straight to the turbine, the way a kettle’s whistle can spin a fan held over the spout. DOE says the design was first used in Italy in 1904 and still runs at The Geysers in northern California, the world’s largest single source of geothermal power.
Flash steam plants, which DOE calls a common type, tap fluid hotter than 182°C (360°F). As that pressurized water reaches a low-pressure tank at the surface, part of it flashes into steam. The steam spins the turbine, and any liquid left can be flashed again in a second tank to extract more energy.
Binary plants work where the resource isn’t scalding hot. The geothermal fluid never touches the turbine. It passes through a heat exchanger and boils a second fluid with a much lower boiling point, which drives the turbine on its own loop.
A geothermal heat pump is a different machine. It moves heat between one building and the ground instead of generating electricity, and what a home ground-source system costs is a separate question.
How much of the US and world electricity comes from geothermal?
US geothermal output has grown about 14% since 2001, from 13.7 billion kWh to 15.6 billion kWh in 2025.
| Year | US geothermal generation (billion kWh) |
|---|---|
| 2001 | 13.7 |
| 2002 | 14.5 |
| 2003 | 14.4 |
| 2004 | 14.8 |
| 2005 | 14.7 |
| 2006 | 14.6 |
| 2007 | 14.6 |
| 2008 | 14.8 |
| 2009 | 15.0 |
| 2010 | 15.2 |
| 2011 | 15.3 |
| 2012 | 15.6 |
| 2013 | 15.8 |
| 2014 | 15.9 |
| 2015 | 15.9 |
| 2016 | 15.8 |
| 2017 | 15.9 |
| 2018 | 16.0 |
| 2019 | 15.5 |
| 2020 | 15.9 |
| 2021 | 16.0 |
| 2022 | 16.1 |
| 2023 | 16.4 |
| 2024 | 15.4 |
| 2025 | 15.6 |
Source: EIA, Monthly Energy Review Table 7.2a for 2001 to 2024, all sectors, and EIA, Electric Power Annual 2025, Table 1.1 for 2025, utility-scale plants only.
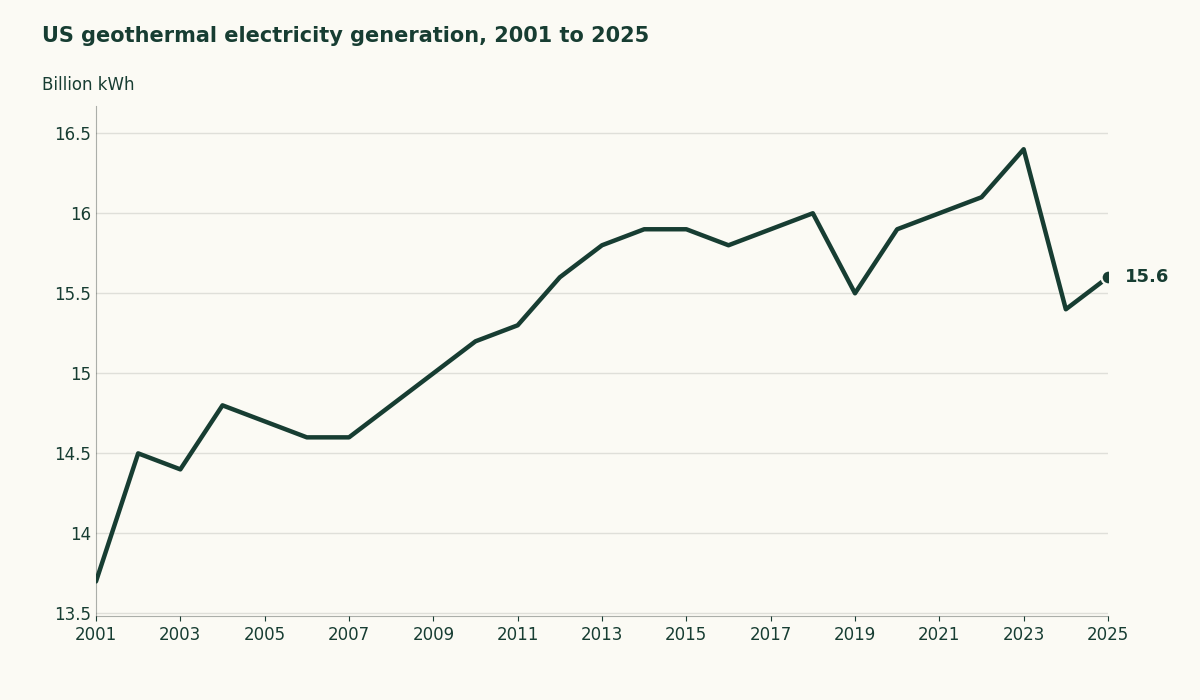
Worldwide, 25 countries generated about 92 billion kWh from geothermal in 2022, and Kenya got the largest share of its own electricity that way, about 43%. That’s roughly 0.3% of the 28,894 TWh the world generated that year.
The IEA’s figure covers all energy demand, and electricity is one slice of that, so the two shares don’t conflict.
Where the world’s geothermal capacity actually sits
Ten countries hold more than 93% of the roughly 17,173 MW of geothermal capacity installed worldwide at the end of 2025, and the United States leads with 3,953 MW.
| Rank | Country | Capacity, year-end 2025 (MW) | Share of world total (%) |
|---|---|---|---|
| 1 | United States | 3,953 | 23.0 |
| 2 | Indonesia | 2,742 | 16.0 |
| 3 | Philippines | 2,034 | 11.8 |
| 4 | Türkiye | 1,797 | 10.5 |
| 5 | New Zealand | 1,259 | 7.3 |
| 6 | Kenya | 980 | 5.7 |
| 7 | Mexico | 976 | 5.7 |
| 8 | Italy | 916 | 5.3 |
| 9 | Iceland | 808 | 4.7 |
| 10 | Japan | 607 | 3.5 |
Source: ThinkGeoEnergy, Global top 10 geothermal power countries at year-end 2025. Shares are our arithmetic on ThinkGeoEnergy’s world total.
ThinkGeoEnergy reports installed nameplate capacity but counts only plants that are operating, so its US total runs above EIA’s 2,683.9 MW of net summer capacity for July 2026, the output a plant can supply at summer peak after its own power use.
These tables mix sources that count differently. The world share above divides an EIA numerator by an Ember denominator for the same year, and EIA’s US figures cover utility-scale plants.
Which US states have the most geothermal power?
California made 68.6% of US geothermal electricity in 2025, but Nevada leans on it harder, with geothermal at 8.6% of its own generation against California’s 5.2%.
| State | Share of US geothermal generation, 2025 (%) | Geothermal share of state generation, 2025 (%) | Net summer capacity, July 2026 (MW) |
|---|---|---|---|
| California | 68.6 | 5.2 | 1,877.9 |
| Nevada | 24.7 | 8.6 | 653.5 |
| Utah | 3.0 | 1.2 | 70.7 |
| Hawaii | 1.6 | 2.7 | 43.0 |
| Oregon | 1.2 | 0.3 | 19.5 |
| Idaho | 0.5 | 0.4 | 10.7 |
| New Mexico | 0.4 | 0.1 | 8.6 |
Source: EIA, Use of geothermal energy for 2025 generation shares and EIA, Electric Power Monthly Table 6.2.B for capacity. Seven states had geothermal plants.
Utah ranks third in the nation for installed geothermal capacity. If you live in California, your power provider may be one of the California utilities holding 500 MW of Cape Station’s first two phases, such as Southern California Edison, Clean Power Alliance or Desert Community Energy.
How much does geothermal power cost?
IRENA put geothermal’s global weighted-average cost at $89 per megawatt-hour in 2025, the second-highest of the seven technologies in the table, behind only concentrating solar.
| Technology | Global weighted-average LCOE, 2025 (USD/MWh) |
|---|---|
| Onshore wind | 33 |
| Solar PV | 44 |
| Hydropower | 62 |
| Offshore wind | 78 |
| Bioenergy | 86 |
| Geothermal | 89 |
| Concentrating solar power | 115 |
Source: IRENA, Renewable power generation costs in 2025. LCOE is the levelized cost of electricity.
Geothermal’s 2024 average was $60 per megawatt-hour, down 16% from 2023, according to IRENA’s earlier report, so the rise to $89 in 2025 spans two IRENA reports.
Lazard’s 2026 analysis puts new US geothermal at $67 to $111 per megawatt-hour without subsidies. That range rests on an illustrative capital cost of $7,000 per kW drawn from publicly disclosed estimates.
DOE’s Enhanced Geothermal Shot sets a target of $45 per megawatt-hour by 2035, a 90% cut in EGS costs. To compare these figures with what you pay at home, see what electricity costs in your state.
Pros and cons of geothermal energy
Geothermal plants can run around the clock, but the US fleet’s 65.9% capacity factor in 2025 sits well below the 91.1% for nuclear.
| Source | US utility-scale capacity factor, 2025 (%) |
|---|---|
| Nuclear | 91.1 |
| Geothermal | 65.9 |
| Other biomass | 58.4 |
| Wood and wood-derived fuels | 55.8 |
| Hydroelectric | 34.4 |
| Wind | 33.8 |
| Solar photovoltaic | 24.0 |
Source: EIA, Electric Power Annual 2025, Table 4.8.B.
The US geothermal figure was 76.0% in 2018, while the IEA put the global geothermal utilization rate at over 75% in 2023. The two cover different fleets and years. For how the measure works, see what capacity factor means.
EIA says geothermal plants emit about 99% less carbon dioxide than fossil-fuel plants, and NREL’s 2017 systematic review of life-cycle emissions by Eberle and colleagues put the median at 32.0 grams of CO2eq per kWh for EGS binary plants, against 47.0 for high-temperature flash plants.
The limits are where the resource sits, what the plants cost to build and, for EGS, the ground shaking that drilling can set off.
What makes enhanced geothermal different
Every power plant above depends on a natural hydrothermal reservoir, and EIA describes hydrothermal resources as underground areas that hold both water and heat. EGS targets hot rock that has the temperature but not the permeability.
Engineers drill into that rock and pump water down at pressure high enough to open cracks in the stone, the way a hydraulic jack uses fluid pressure to lift a car. At Utah FORGE, stimulating the wells in April 2024 created the fracture network that forms the reservoir. Crews then pump cool water down an injection well and draw it back up through a production well.
If EGS works at scale, geothermal can reach beyond the plate edges where natural reservoirs cluster. DOE’s March 2024 Liftoff report sees US geothermal reaching 90 GW or more by 2050, a twentyfold increase. The IEA sees potential for up to 800 GW worldwide and says costs for newer geothermal technologies could fall 80% by 2035, to around $50 per megawatt-hour.
The Utah projects testing whether EGS scales
Fervo Energy says Cape Station in Beaver County, Utah is the first greenfield EGS development in the world to reach contractual commercial operation, and that its first GeoBlock produced 33 MW of net power after a 23-month build and commissioning.
A smaller Nevada pilot, Project Red, came before it. A 30-day well test there supported 3.5 MW of electricity from a horizontal well pair with 3,250-foot laterals, and Project Red came online in 2023 and has supplied the local grid since. A 2024 Cape Station test reached a maximum flow of 107 kg/s at high temperature, potentially enabling over 10 MW, according to Utility Dive.
Fervo says about 900 MW of Cape Station is fully contracted. Google signed a 396 MW agreement on September 1, 2026 for a Utah data center, following a 320 MW agreement with Southern California Edison in 2024.
| Date | Milestone |
|---|---|
| Sep 2023 | Groundbreaking at Cape Station |
| 2024 | Southern California Edison signs for 320 MW |
| Apr 2025 | Shell Energy signs for 31 MW and Cape Station grows to 500 MW |
| May 2026 | Fervo lists on Nasdaq |
| 1 Sep 2026 | Google signs for 396 MW |
| 24 Sep 2026 | First Power at the first GeoBlock |
| 30 Sep 2026 | First GeoBlock declares commercial operation at 33 MW net |
| 1 Jan 2027 | Remaining two Phase I GeoBlocks due |
| 2028 | Phase II, an additional 400 MW, due |
Source: Canary Media, ThinkGeoEnergy on the Google agreement, Fervo Energy on the Shell agreement, ThinkGeoEnergy on the Fervo IPO and Fervo Energy on commercial operation. The dates for later phases are Fervo’s expectations.
Utah FORGE is the Department of Energy’s EGS research site near Milford. It ran a 30-day circulation test in August 2024 that produced temperatures around 370°F and began an extended circulation test in August 2026, a stage DOE says only a handful of EGS projects worldwide have reached. DOE extended the project through 2028 with an additional $80 million.
Drilling costs, earthquakes and permits still slow EGS down
Well costs have fallen. A 2025 Stanford Geothermal Workshop study found vertical wells cost 12% to 24% less than a 2017 baseline. Horizontal wells cost 18% to 26% less. The study credits PDC drill bits and oil and gas techniques such as multiwell pad drilling.
That doesn’t make EGS cheap. CleanTechnica’s Michael Barnard wrote in November 2025 that EGS projects often sit at $10,000 to $15,000 per kW, and that a project may need four and a half to seven years from first drilling to commercial operation. Fervo’s build time, quoted above, covers the power facility and not the drilling before it, so it doesn’t settle Barnard’s estimate. Barnard’s per-kilowatt figure is an analyst’s estimate, and Lazard’s illustrative figure for new geothermal in the cost section is lower.
Induced seismicity is the other hard limit, and it has already ended a project. The Basel, Switzerland EGS project started hydraulic stimulation in December 2006, and a local-magnitude 3.4 quake hit five hours after the stimulation well was shut in. The quakes caused no injuries but led to $9 million of damage, and the project was shut down permanently in December 2009.
Fervo ran Project Red under an induced seismicity mitigation protocol built on DOE best practices and says it finished without incident.
On US federal land, permitting runs through the Bureau of Land Management, which has authority to manage geothermal leasing on approximately 245 million acres of public land, plus 104 million acres of Forest Service land. In April 2024 it adopted two categorical exclusions for geothermal exploration, though developing a resource still requires further environmental analysis.
Geothermal Rising, a trade group, says the 2025 tax law preserves full 48E and 45Y credits for geothermal projects that begin construction by 2033, phasing down through 2036.
The Cape Station blocks still to come online
Two more 33 MW GeoBlocks are due at Cape Station by January 1, 2027, and a further 400 MW is under construction for 2028. Google’s agreement covers a Utah data center, and how AI load is straining aging wires explains the grid pressure behind deals like it.
The extended circulation test at Utah FORGE pumps cool water for months, and DOE says it should answer the pressing questions about thermal decline and water loss. FORGE publishes its data through DOE’s Geothermal Data Repository, so you can check the results yourself when the test ends.